Doel :
Om gemakkelijk een grafiek met Python te plotten heb je 2 extra pakketten nodig:
- numpy : een bibliotheek om gemakkelijk met cijferreeksen te werken (arrays)
- matplotlib : een bibliotheek om gemakkelijk gedetailleerde grafieken uit te tekenen
Deze pakketten kun je gemakkelijk installeren in je Thonny ontwikkelomgeving voor Python via het menu : “Hulpmiddelen – Pakketten beheren’.
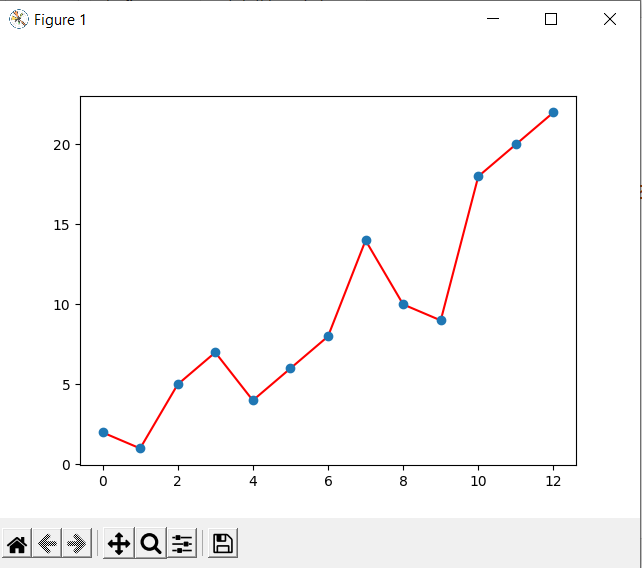
Voorbeeld 1
# matplotlib grafiek.py
#----------------------

import numpy as np
import matplotlib.pyplot as plt

y = np.array([2, 1, 5, 7, 4, 6, 8, 14, 10, 9, 18, 20, 22])
x = np.arange(13)

plt.plot(x, y, 'red')    # line
plt.plot(x, y, 'o')      # dots

plt.show()

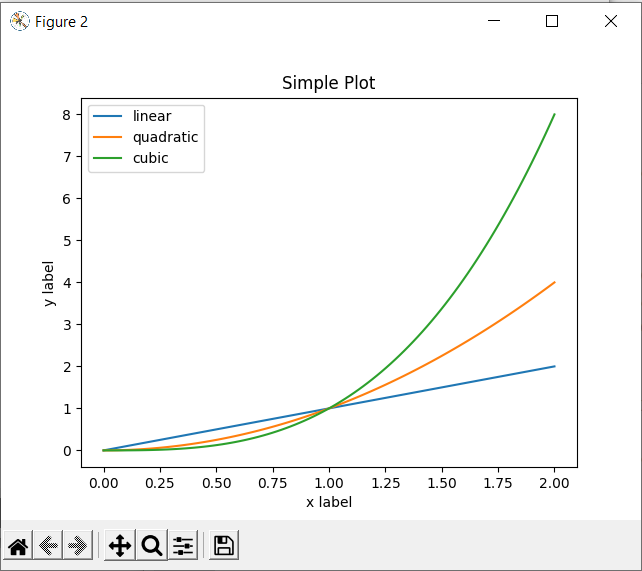
Voorbeeld 2
#plotfiguur.py
#-------------

import matplotlib.pyplot as plt
import numpy as np

fig, ax = plt.subplots()  # Create a figure containing a single axes.

x = np.linspace(0, 2, 100)

# Note that even in the OO-style, we use `.pyplot.figure` to create the figure.
fig, ax = plt.subplots()  # Create a figure and an axes.
ax.plot(x, x, label='linear')  # Plot some data on the axes.
ax.plot(x, x**2, label='quadratic')  # Plot more data on the axes...
ax.plot(x, x**3, label='cubic')  # ... and some more.
ax.set_xlabel('x label')  # Add an x-label to the axes.
ax.set_ylabel('y label')  # Add a y-label to the axes.
ax.set_title("Simple Plot")  # Add a title to the axes.
ax.legend()  # Add a legend.

plt.show()

